Core PCE Versus Trimmed-Mean PCE Inflation*
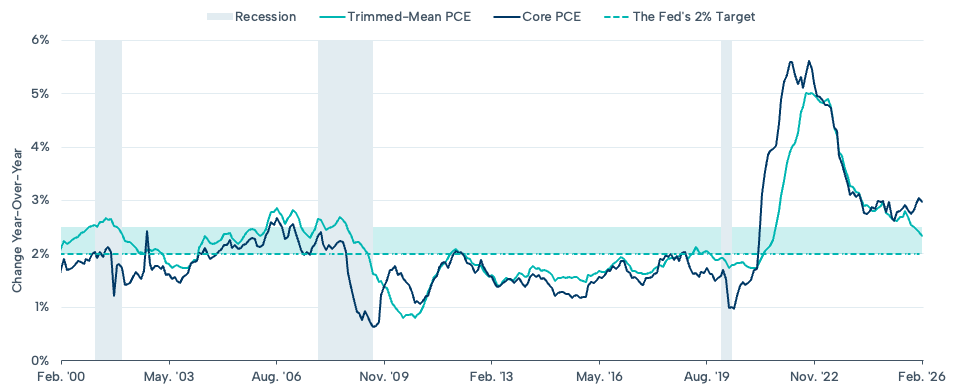
Data released this week showed that core Personal Consumption Expenditures (PCE) inflation has hovered near 3% for 27 consecutive months through February. But is core inflation stuck at 3%? One way to assess this is trimmed-mean PCE, which strips out the highest and lowest monthly readings to provide a cleaner gauge of underlying inflation. Unlike core, trimmed-mean PCE moderated to 2.3% in February, much closer to the Fed’s 2% target, and has historically been the more reliable signal when the two measures diverge. For example, in 2009, core PCE accelerated sharply but eventually slowed and converged with the trimmed-mean. Similarly, in 2015 and 2019, following core PCE would have sparked deflation fears, whereas the trimmed-mean measure was much more stable. In the post-Covid inflation spike, while trimmed-mean accelerated more slowly than core, it peaked lower and helped ease market concerns about further Fed tightening in 2023. Today, the gap between the two reflects idiosyncratic and seasonal shocks to inflation in goods and nonhousing services. With a weakening labor market and moderate wage growth, is core still the signal or just noise? We lay out the history—you decide.